After Microsoft's announcement of this key integration between D365 and Power BI, I decided to get some hands-on exposure to the features and functionality itself.
Let's get the important information out of the way first. LICENSING!!!
To avail of this functionality or even just test it out, you will need a CE license of some kind, i.e. Sales or Customer Service Professional, even Marketing or Power Apps licensing will do. In addition to this, you will need at least the Power BI Free license applied to your user account as well. For the purpose of this blog post, I decided to set up a trial of Power BI and connect it to my existing D365Ni tenancy.
The initial setup is very simple, if your instance/tenant has access to this feature, you will see the following options outlined below.
Firstly, access make.powerapps.com, select the environment you want to work on, in the top right-hand corner, then select the App you are using, i.e. Sales Hub, Customer Service Hub and select the "Edit in Preview" option

Once in Edit in Preview mode, select Settings from the top left and the following screen of options will appear, navigate to the Features option and "Enable Power BI quick report visualisation on a table". Note at this point, if you do not see the option, the feature has not yet been released to your tenancy or the host your tenancy resides in.

Once you Save & Publish the "Visualise this view" option will appear in the ribbon within any view in the App you added the feature too.

The initial load will take a few minutes to complete but once it does, you will be presented with a pre-baked Power Bi visualisation of your view, in this case, I select "All Opportunities"
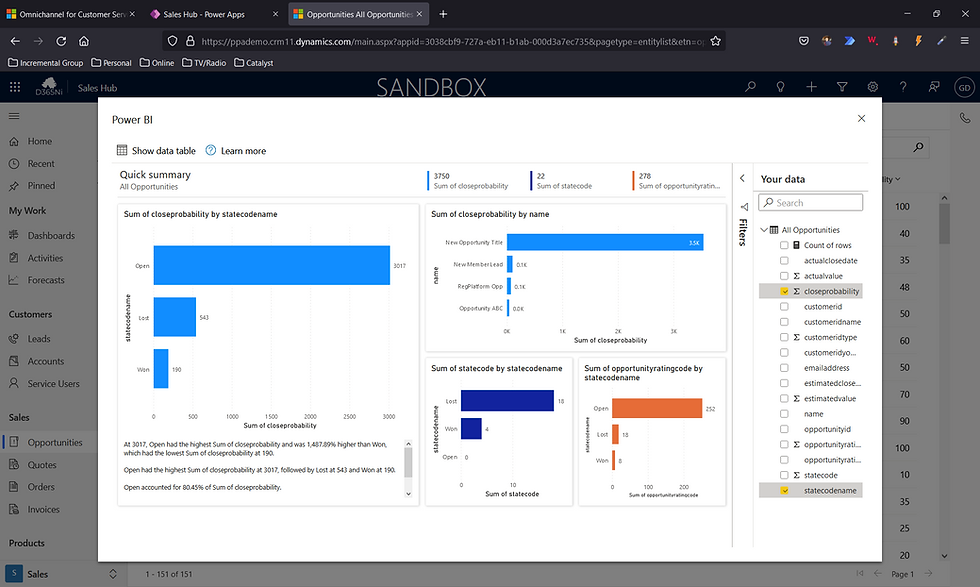
You have a number of options you can use to tweak the dashboard slightly, in the top left for example is a "Show Data Table" option which will add a view/table of the data to the bottom of the dashboard.

You can also pull additional data onto the dashboard, by selecting additional fields and parameters from the "Your Data" option on the right-hand side.

And you can also tweak each of the individual elements by selecting the little edit option which appears when you hover to the right of each visual.

And of course, you can expand and drill down into each visual as well, creating a full-screen rendering of a particular element.

Overall, the first experiences of this feature are excellent. It creates that direct link between D365 and Power Bi allowing for ad-hoc, on the move reporting at a glance, without having to move to another application or each tab on your browser.
I will be keen to see what the stage in this integration looks like, will we be able to edit the boards in more detail, will we be able to personalise them on a user by user basis and will we start to see more pre-baked visualisations specific to each application, i.e. Sales/Customer Service/Marketing.
Comentarios